The Founder Effect: United States 2026
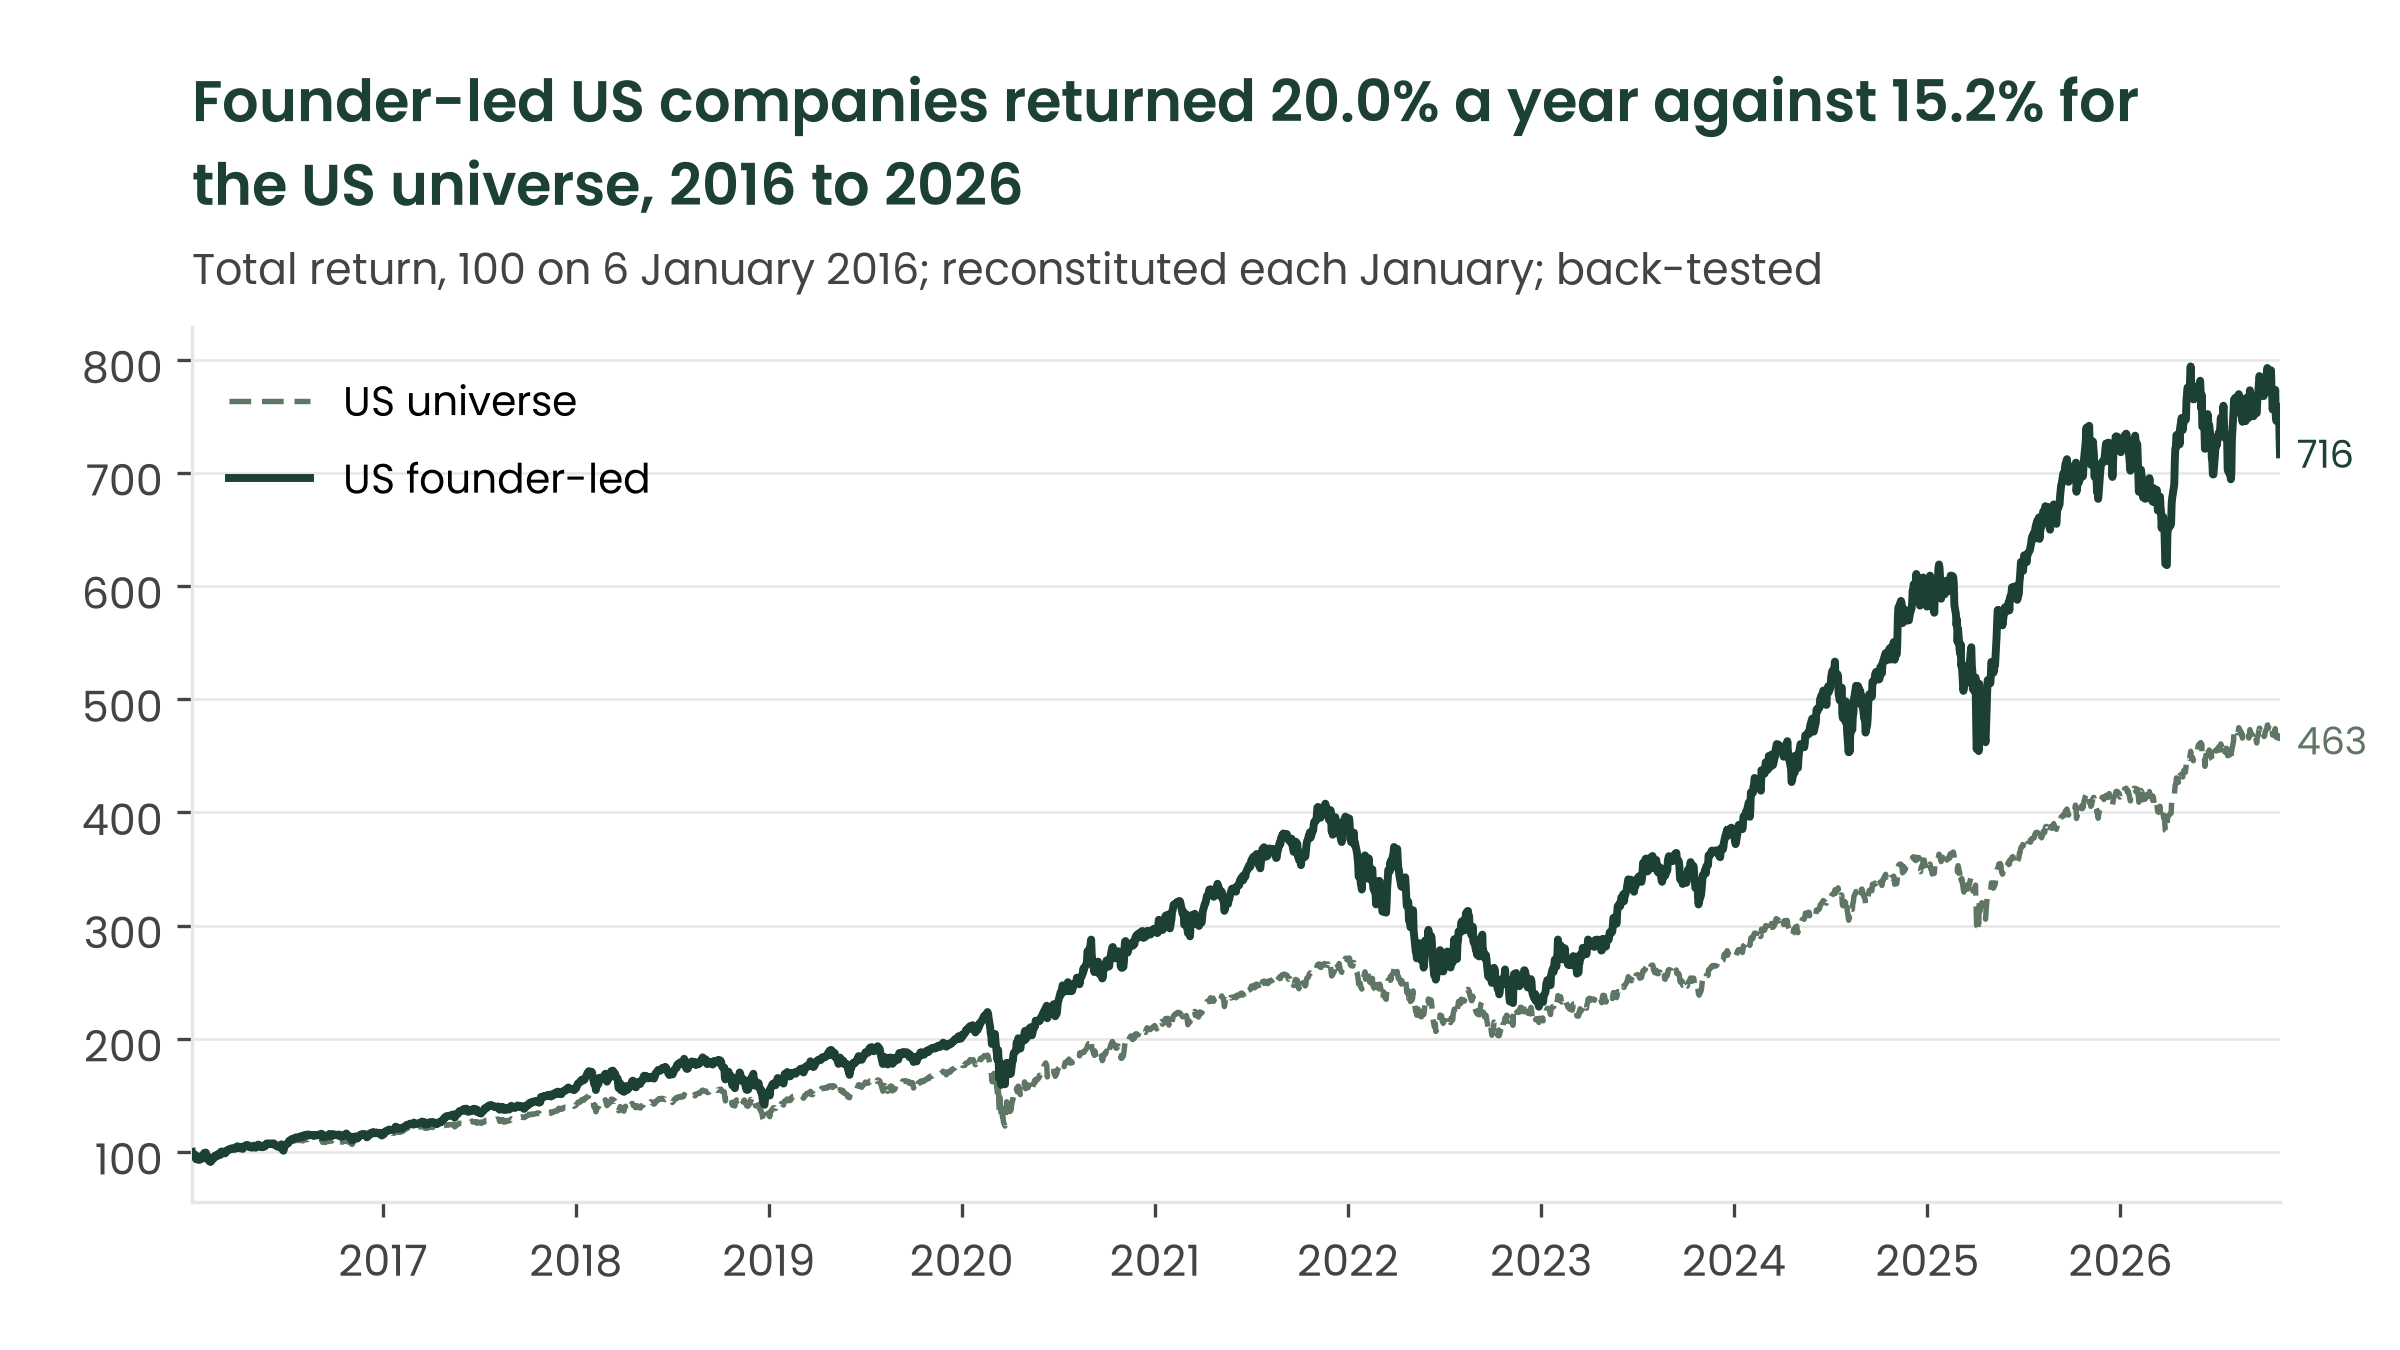
Founder-led US companies returned 20.0% a year from 2016 to 2026 against 15.2% for the US universe. The return came from founders who still run their companies.


This addendum extends The Founder Effect Annual Report 2026 to the United States, the market that holds most of the world's founder-led value. It asks how large the founder-led part of the US large and mid-cap market has become, whether it has rewarded shareholders, and which kind of founder influence has delivered the result.
Headline findings
- Founder-led companies were 31.0% of the free-float value of large and mid-sized US companies at 31 October 2026, up from 13.1% in January 2016. The share peaked at 34.0% in January 2026.
- Back-tested from January 2016, founder-led US companies returned 20.0% a year against 15.2% for the US universe, an advantage of 4.8 percentage points a year. They led in 8 of 10 full calendar years.
- The return came from founders who still run their companies. The operator group returned 23.0% a year, against 18.6% for founders who sit on the board without running the company and 11.2% for founding families.

Which kind of founder influence has performed
Founder-led is a binary classification. Within the founder-led group, Lumenary's founder influence matrix reads two further things about each company: how the founder is present, and how much of the company the founder or the founding family still holds. Over the ten years the answer is the founders who kept running their companies: the operator group finished 4.4 percentage points a year ahead of the stewards and 7.7 points ahead of the US universe. The size of the founder's stake explains much less; the largest operators hold small stakes because they diluted themselves on the way to today's size, while their influence stayed intact through the chief executive's chair.

Control and operation are different things
At 31 October 2026, companies run by their founder were 21.4% of US market value, and companies whose founder or founding family holds voting control were 9.4%. Supervoting share classes explain much of that control: several founders hold a majority of the votes with a minority of the shares. The two overlap, since most founder-controlled companies are also run by their founder, but most founder-run value is not locked in: only 20% of it sits where the founder holds voting control.
Concentration is real
The return came with deeper falls. In the 2022 rate shock the founder-led series fell 40% against 19% for the US universe, and its largest fall from a peak was 44% against 34%. The group is concentrated: the ten largest founder-led companies are 24% of US market value, up from 9.3% in 2016, and they account for most of the group and nearly all of its growth. The window matters too. Measured from January 2025 the founder-led series is behind the US universe, 11.1% a year against 16.6%. The founder effect in the United States is a long-run result that rests on a few large growth companies.
Upcoming blockbuster IPOs
The next wave is already visible. The largest private companies preparing to list are founder-run, and the most recent large listings came to market with share structures that keep voting control with their founders. We expect the founder-led share of the US market to keep rising, and the founder-controlled share with it, from two sources: the listings to come, and the value that already-listed founder-led companies keep creating.
Adding the founder-run companies preparing to list to the US universe at their latest reported valuations, every share counted, would lift the founder-led share of US value from 31.0% to 33.7%: Anthropic would take it to 32.1%, and OpenAI on top of that to 33.4%. The float at listing would be a fraction of these values, so the index-weighted effect would be smaller and would build as lockups expire.

Download the report
The Founder Effect: United States 2026 (PDF) →
Lumenary Research publishes evidence on founder-led companies globally. Subscribe to receive new research as it is released.
Analysis by Lumenary Research using Solactive index and market data. Solactive AG has not sponsored, endorsed, approved or sold this research and does not guarantee the accuracy of its data; references to Solactive AG are for data attribution only. Results are back-tested: today's founder-led classification carried back over historical prices, not the record of a live index, and past or simulated performance is not a reliable indicator of future performance. Research and general information only; not financial product advice.