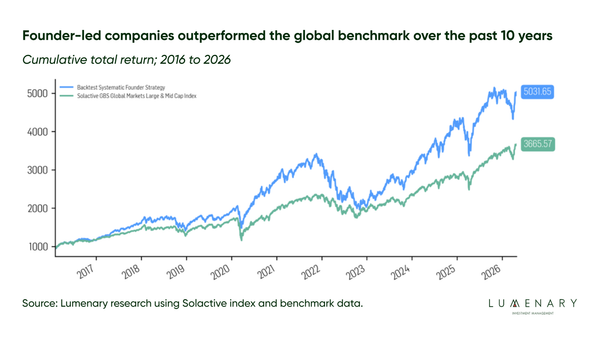
The Founder Effect: China and Hong Kong 2026
Founder-led China A-shares returned 13.75% a year from 2020 to 2026 against 0.63% for the China all-cap index. Hong Kong went the other way.

This addendum applies the Founder Effect framework to two of the world’s most important non-US equity markets. It uses an instrument-level rather than company-level approach, because a China A-share listing and a Hong Kong listing of the same underlying business can differ in liquidity, investor access, index eligibility, currency and implementation pathway.
China A-shares
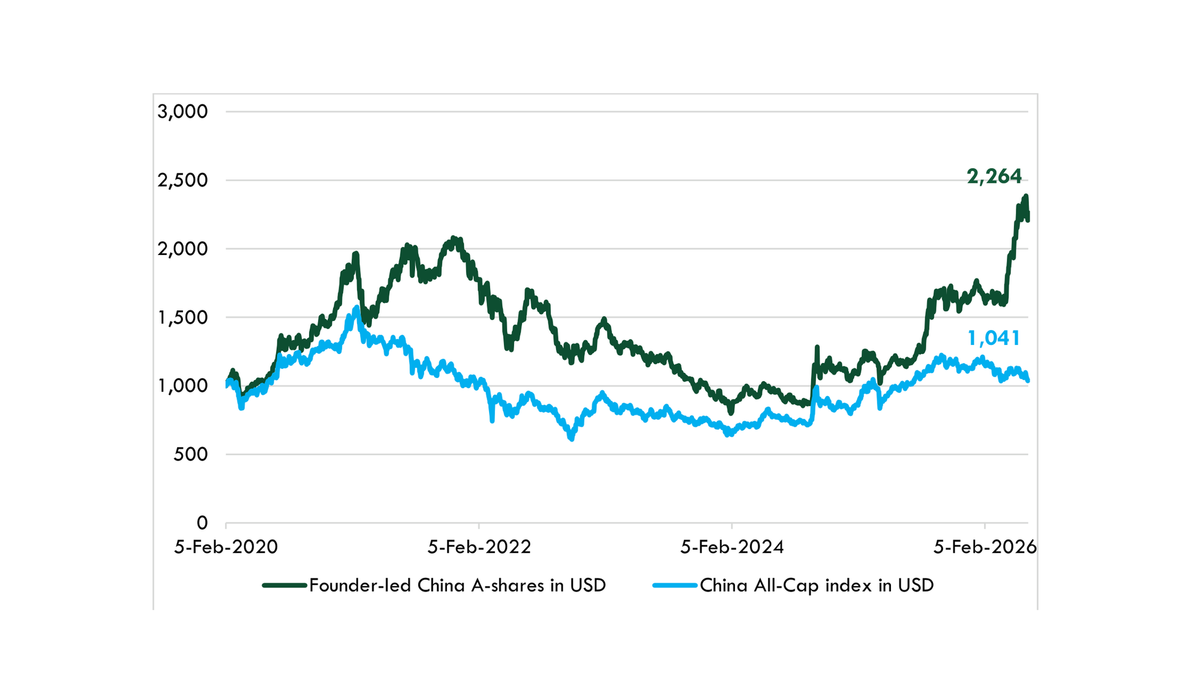
Founder-led China A-share companies returned 13.75% annualised from 2020 to 2026 against 0.63% for the China all-cap index – an advantage of 13.11 percentage points a year, and 126.42% cumulative against 4.10%. That was achieved through regulatory pressure, property-sector stress, weak investor sentiment and the post-2021 growth reset.
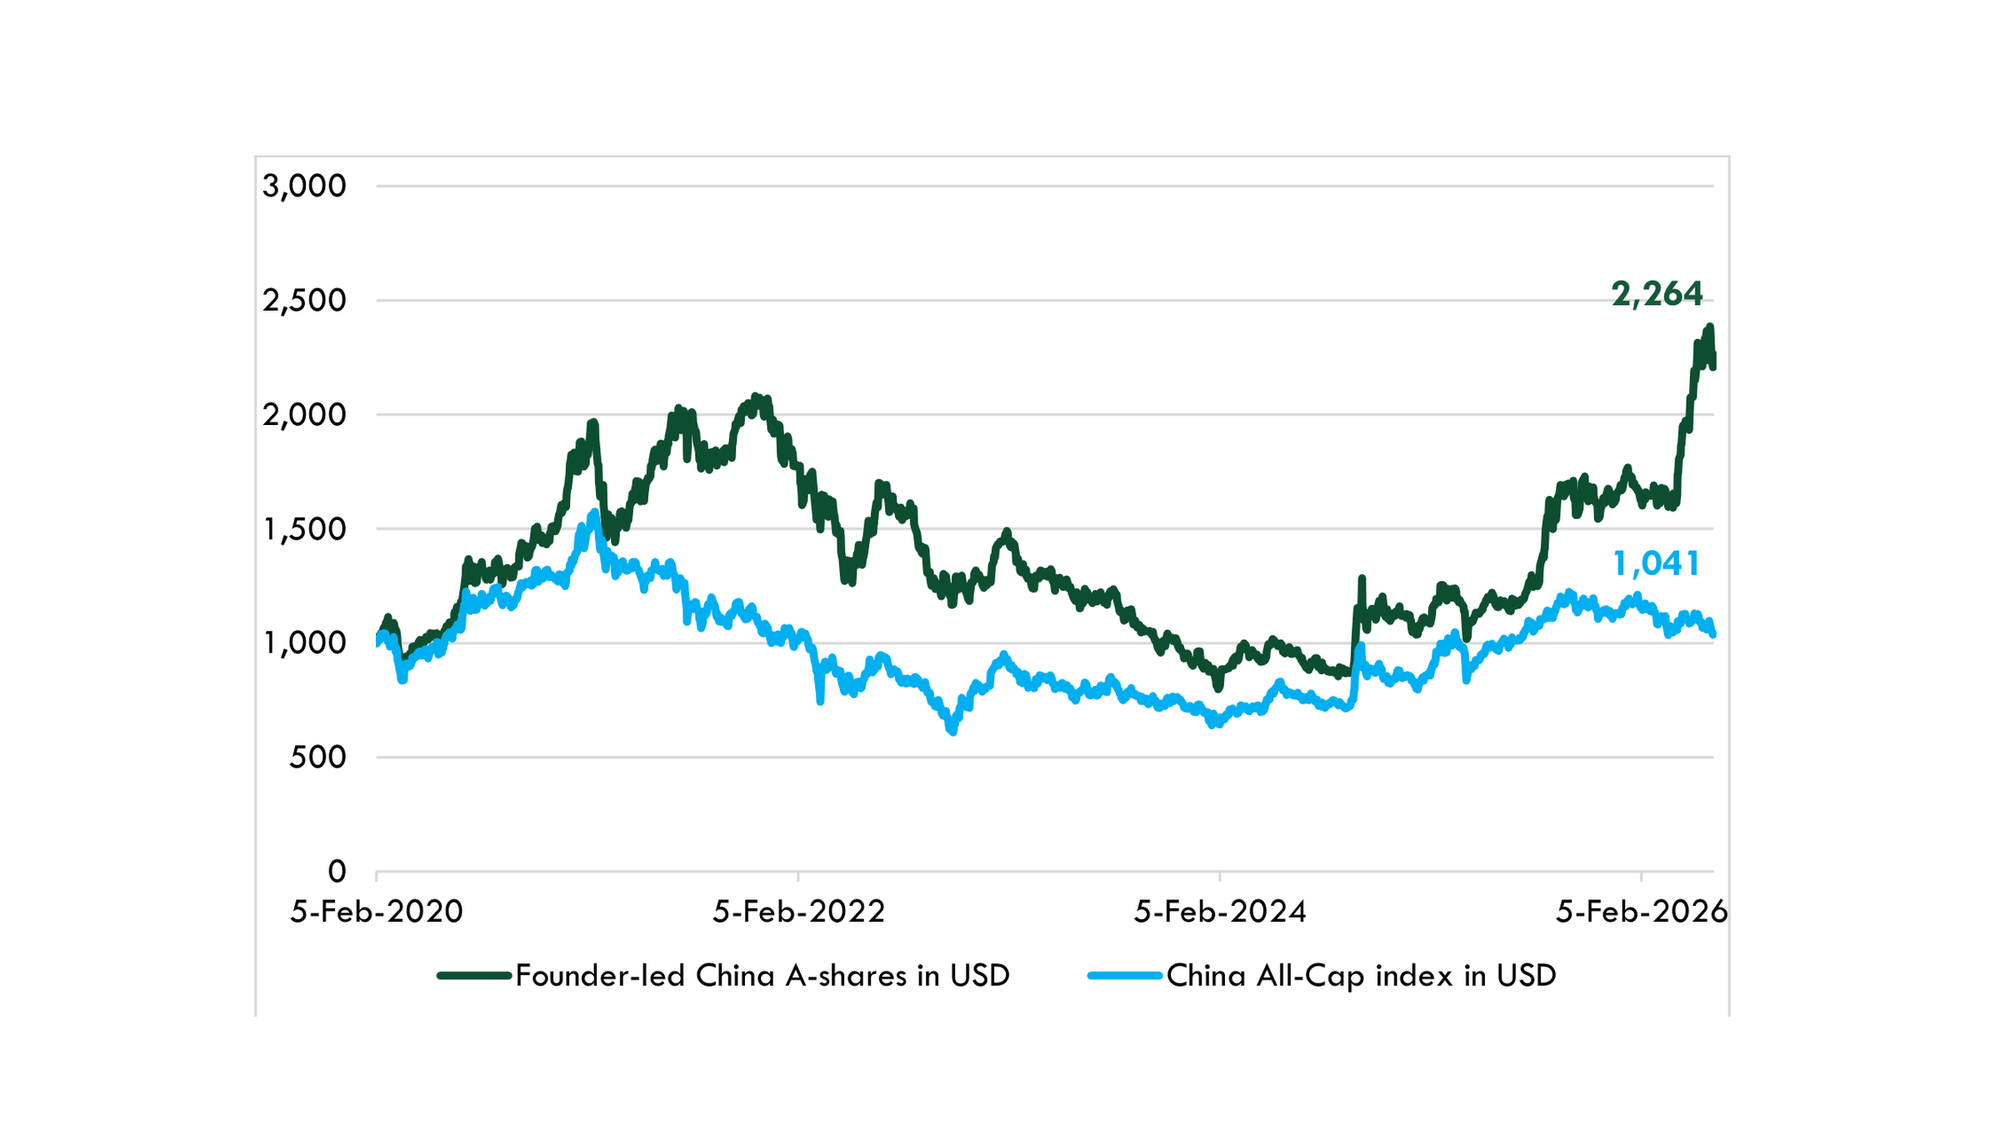
The path was not smooth. The cohort underperformed in 2022 (-35.05% against -21.76%) and 2023 (-24.23% against -10.14%) as its growth, technology and innovation tilt met rising rates and weak China sentiment, and again in 2024. It recovered in 2025 (+51.93% against +32.17%) and 2026 as capital rotated back toward AI infrastructure, semiconductors, electric vehicles, batteries and advanced manufacturing – the areas where founder-led exposure was concentrated.
Hong Kong
Hong Kong went the other way. The founder-led cohort returned -3.35% annualised, outperforming strongly in 2020 and again in 2024 but underperforming across the full period. Where China’s founder-led universe offers depth, Hong Kong’s offers scale: it is concentrated in offshore-listed China platform and consumer-technology groups such as Tencent, Xiaomi, Meituan and JD.com, which are far larger than most China A-share founder-led companies.
Market structure
- Founder-led instruments were 31.5% of China’s listed market value in 2026 and 48.9% of Hong Kong’s.
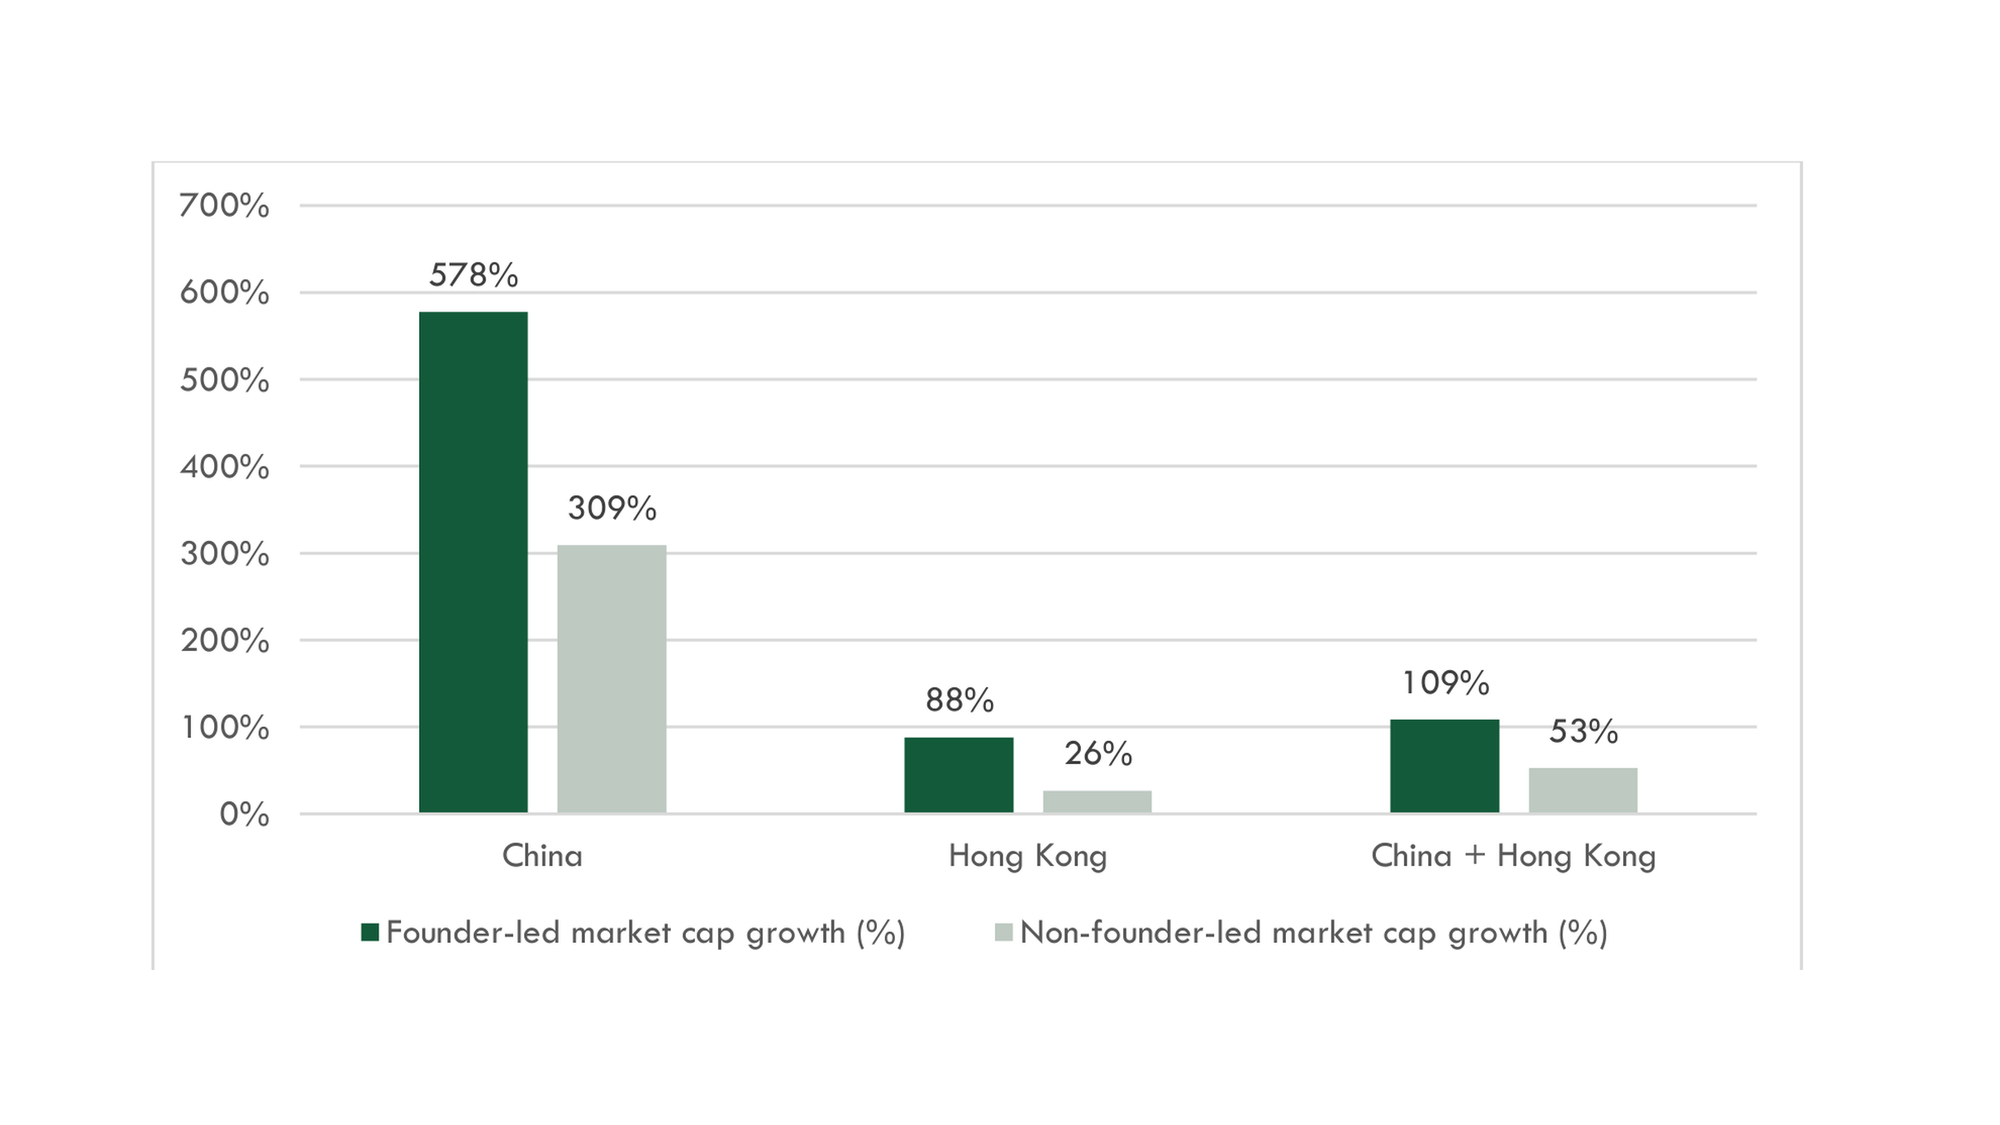
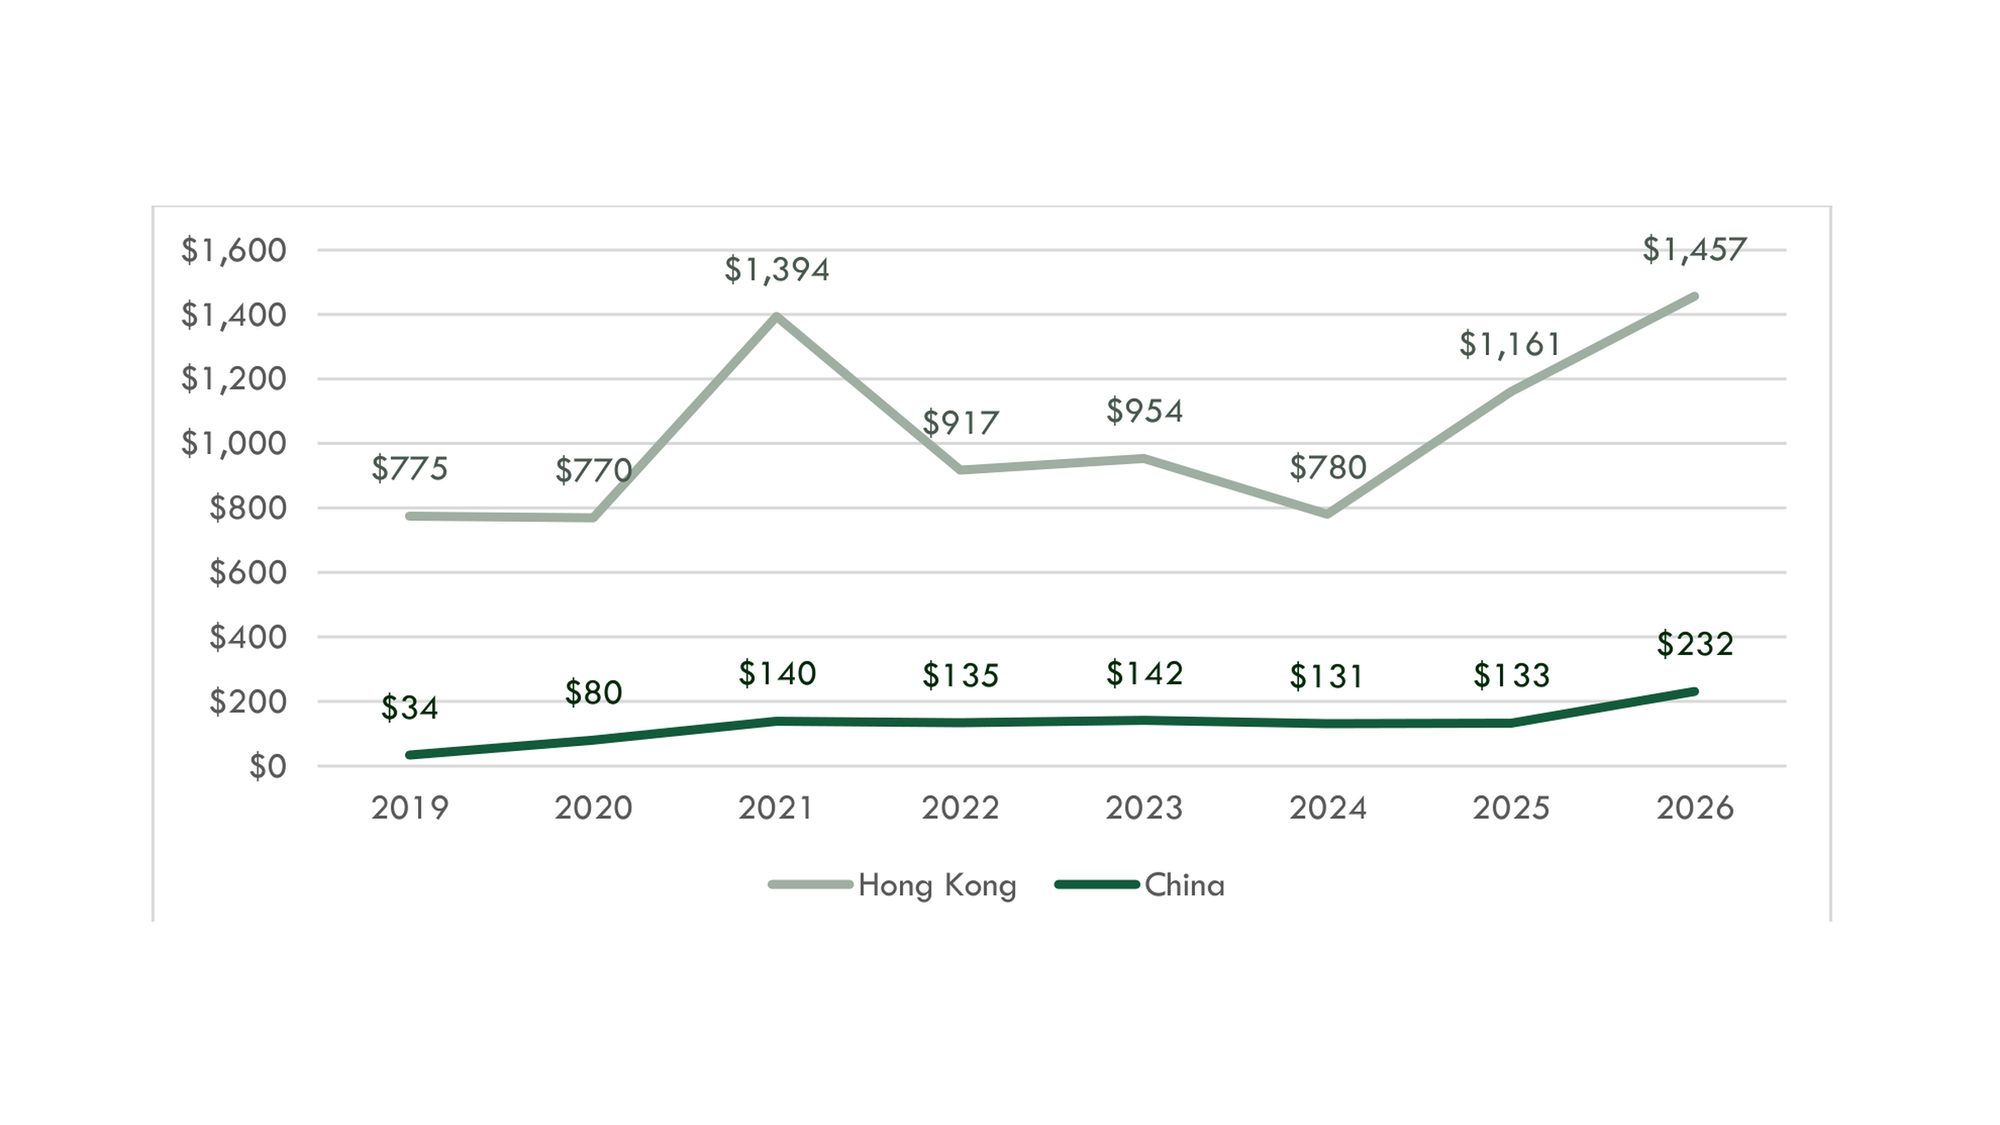
- Founder-led market capitalisation grew 578% in China from 2019 to 2026 against 309% for non-founder-led companies; in Hong Kong it grew 88% against 26%.
- China had 1,019 founder-led instruments among 3,217; Hong Kong had 290 among 678. China has the broader pipeline, Hong Kong the greater concentration of value.
- Both cohorts carried substantially more risk than the global picture: annualised standard deviation of 28.56% in China and 29.40% in Hong Kong, with maximum drawdowns of -61.70% and -65.00%.
Sector composition
A founder-led screen produces a very different China exposure from the broad market: less weighted to banks, utilities, energy and state-linked incumbents, and more weighted to technology, advanced manufacturing, healthcare and consumer innovation.
Between 2019 and 2026, founder-led market-cap growth exceeded non-founder-led growth in most Chinese sectors, led by utilities, industrials and consumer cyclicals. It lagged in financial services, energy and technology. In Hong Kong the strongest relative growth came from technology, consumer defensive and healthcare, while real estate, utilities, financial services and consumer cyclicals lagged.
The broader finding is that this is not a narrow technology story. The strongest signal appears where entrepreneurial control intersects with industrial upgrading – electrification, automation, supply-chain depth and domestic innovation.
Download the report
The Founder Effect: China and Hong Kong 2026 (PDF) →
Lumenary Research publishes evidence on founder-led companies globally. Subscribe to receive new research as it is released.
Analysis by Lumenary Research using Solactive index and benchmark data. Solactive AG has not sponsored, endorsed, approved or sold this research and does not guarantee the accuracy of its data; references to Solactive AG are for data attribution only. Results are historical and partly backtested, and past or simulated performance is not a reliable indicator of future performance. Research and general information only; not financial product advice.