The Founder Effect: Annual Report 2026
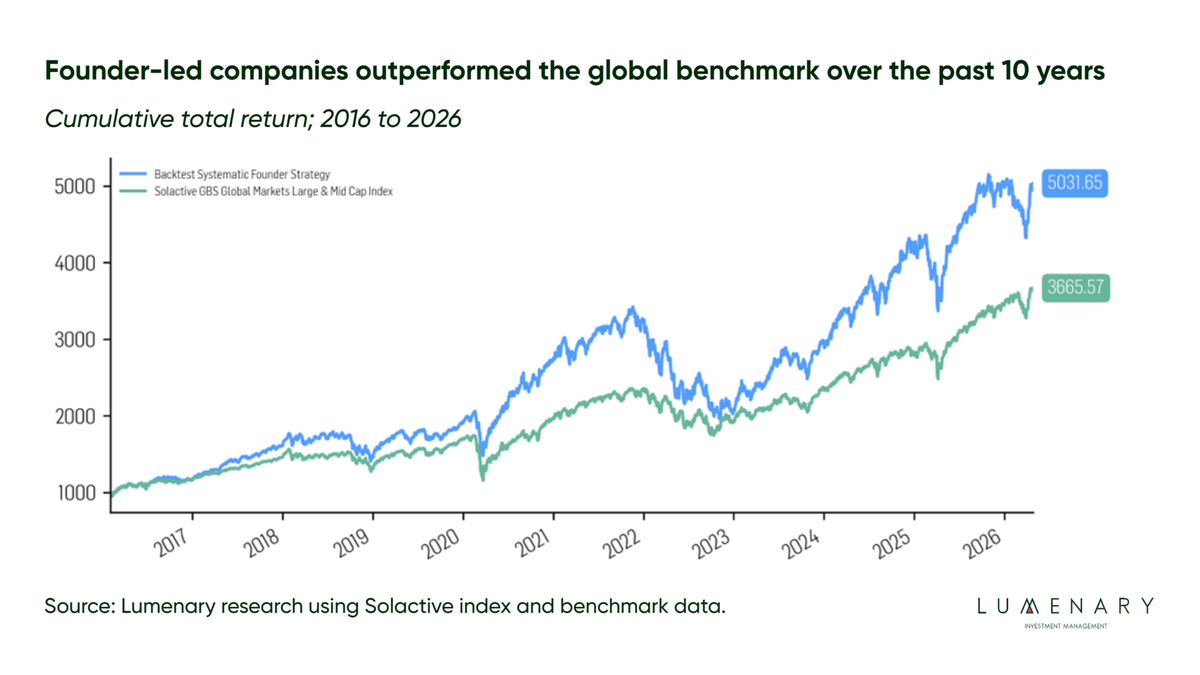
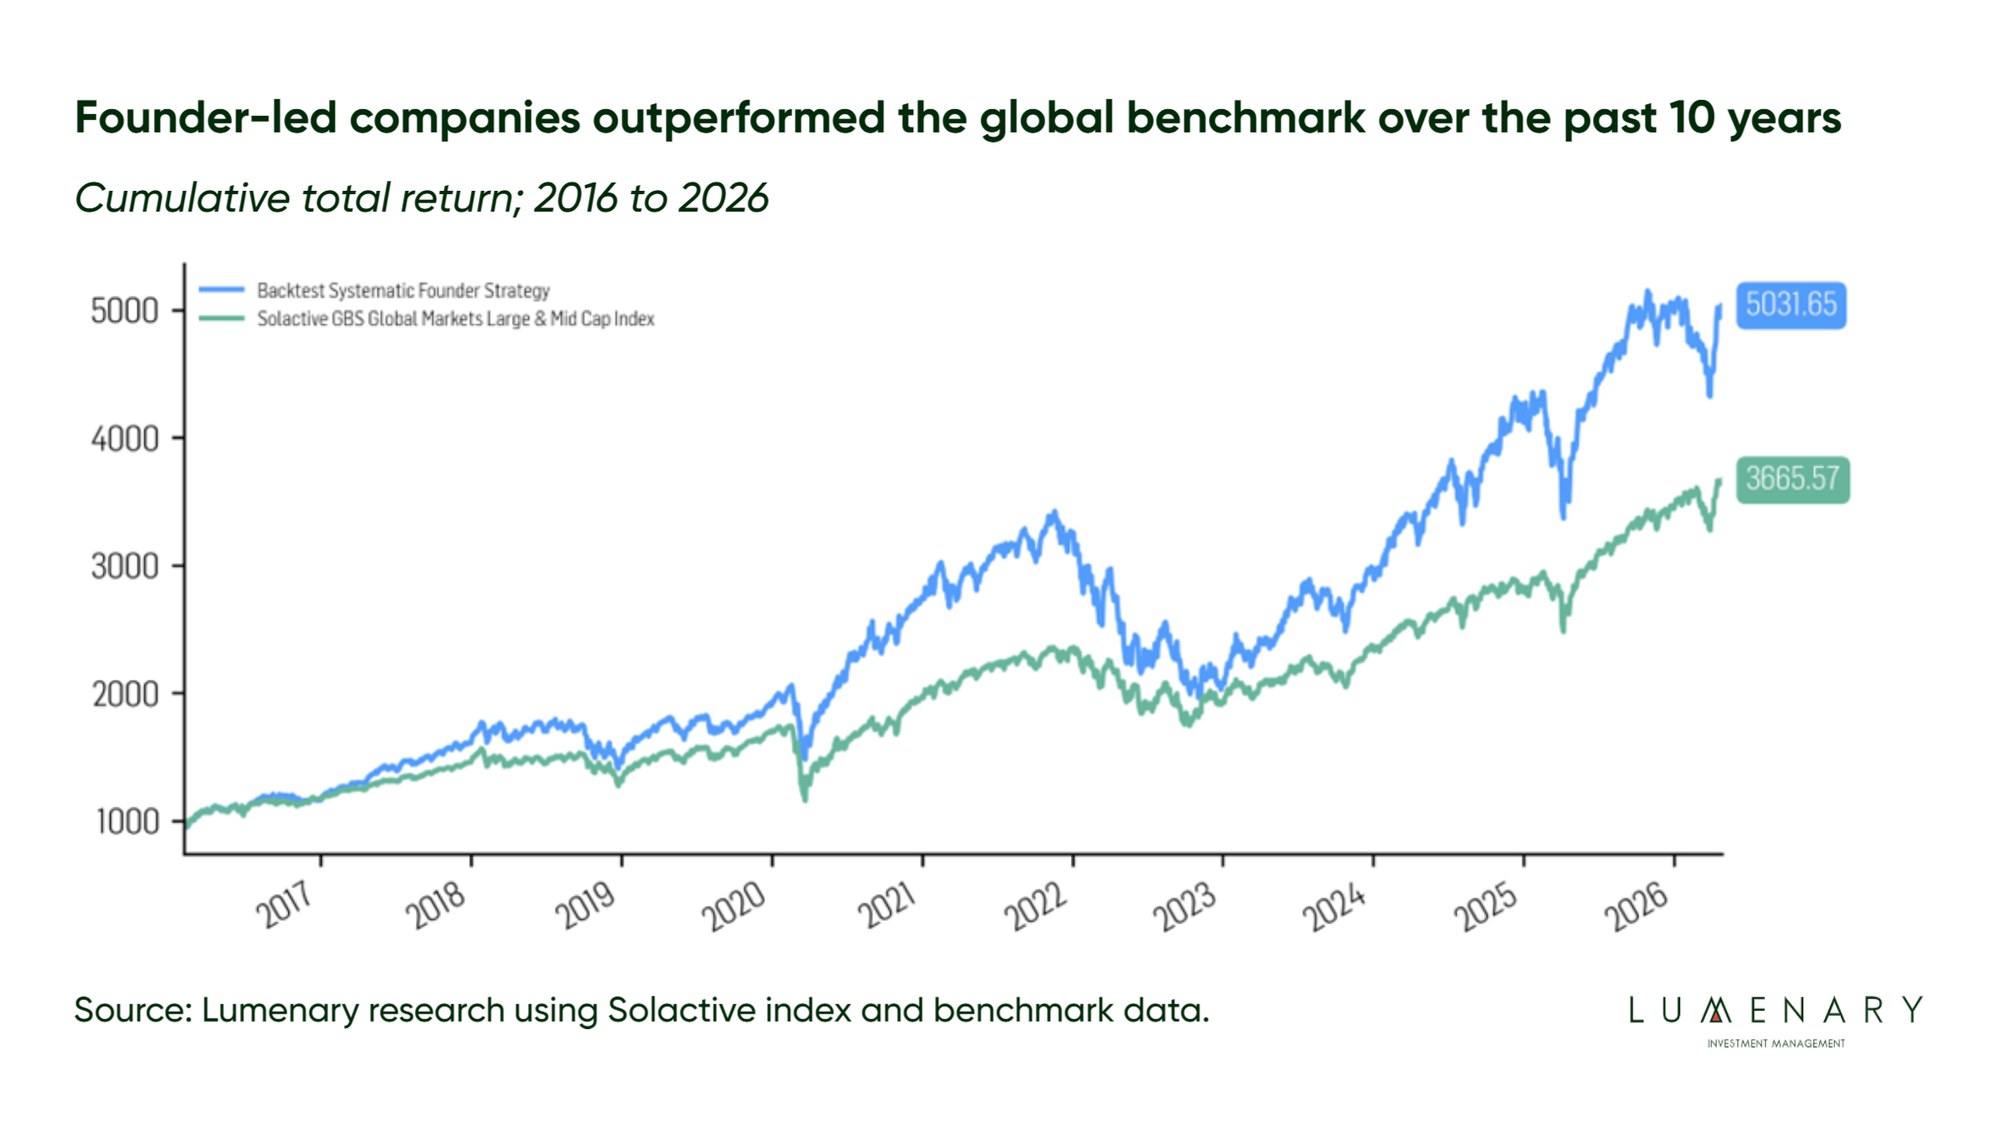
Founder-led companies returned 17.10% a year from 2016 to 2026 against 13.53% for the benchmark.

The Founder Effect Annual Report 2026 applies Lumenary’s founder-influence framework to a global listed equity universe over the period January 2016 to April 2026, and tests whether founder influence is visible in shareholder returns, risk, market-cycle behaviour and company fundamentals.
Headline findings
- Founder-led companies returned 17.10% annualised over the period, against 13.53% for the benchmark and 11.9% for non-founder-led companies – an advantage of roughly 357 basis points a year. Indexed to 1,000 at the start of 2016, the founder-led series reached 5,031 against 3,665 for the benchmark.
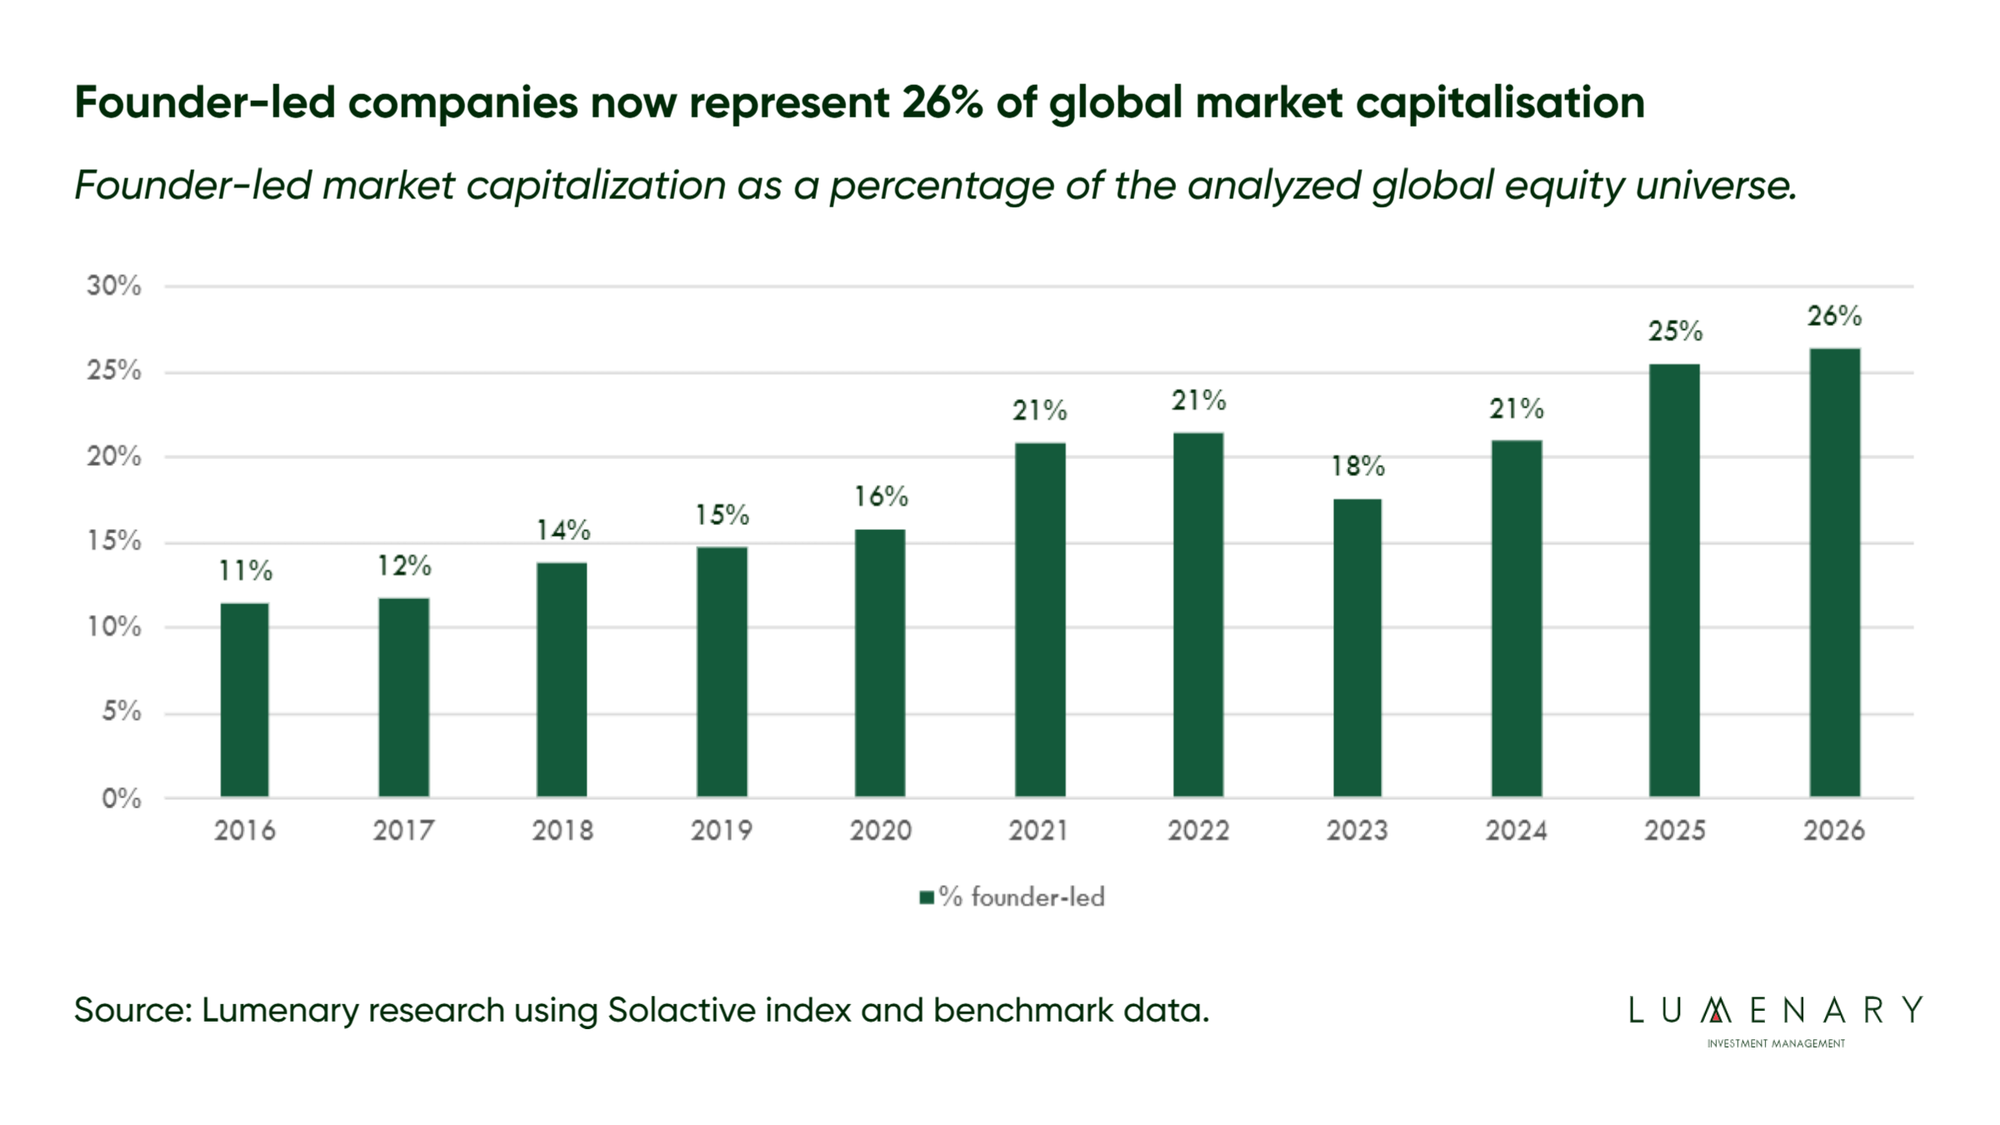
- Founder-led companies represented 26.4% of global equity market capitalisation in 2026, up from 11.6% in 2016.
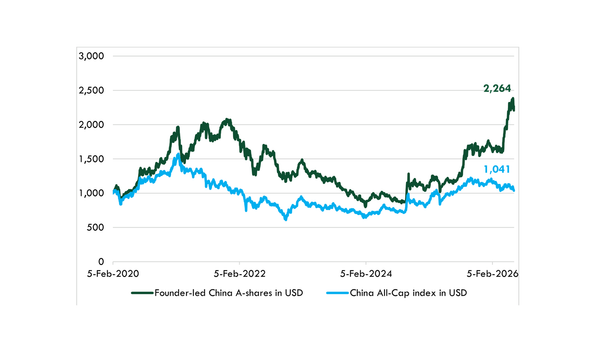
- The United States accounts for 74% of global founder-led market value, but China has the highest domestic penetration: founder-led companies are 52% of Chinese listed market capitalisation against 32% in the United States.
Where the value was created
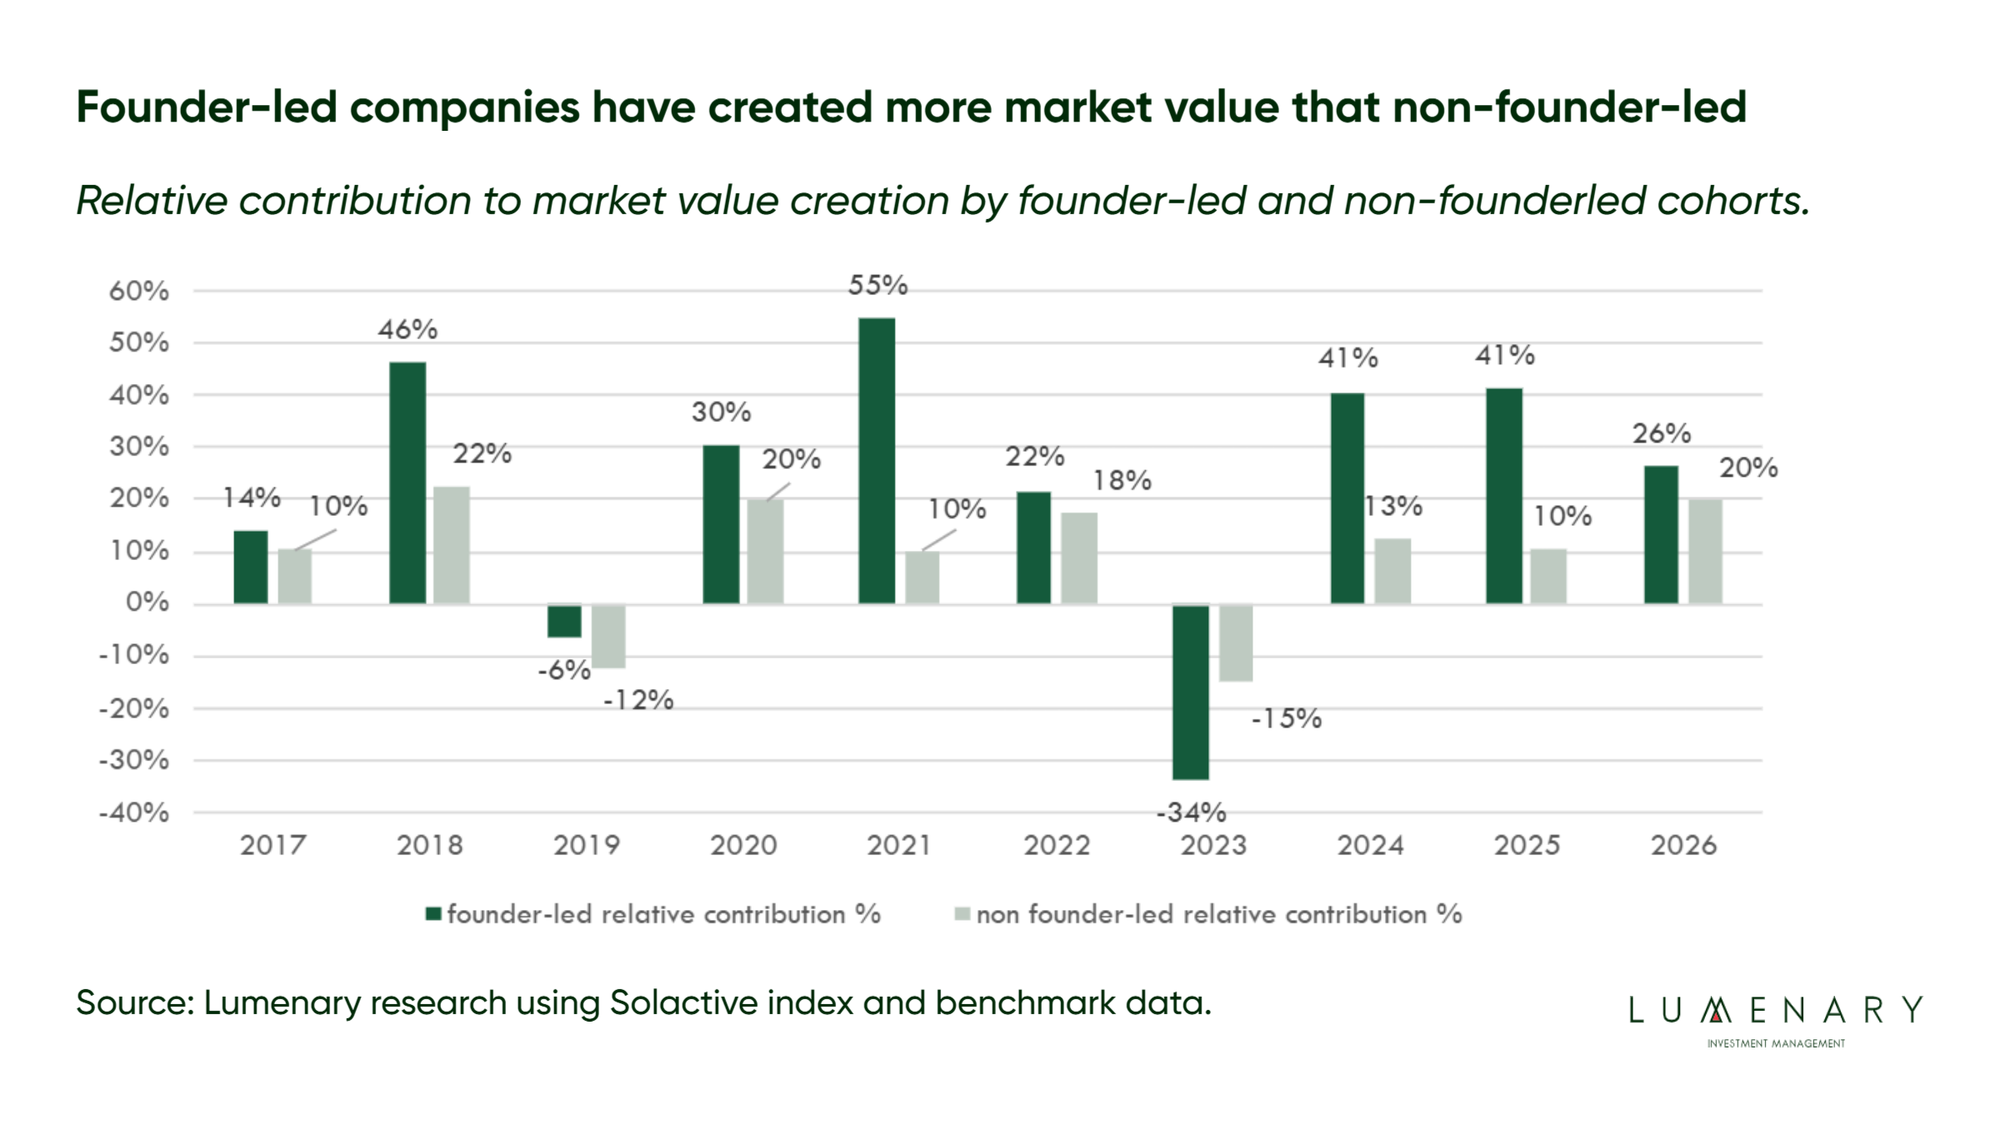
Decomposing each year’s market value creation between the two cohorts shows the founder-led group contributing more than its non-founder-led counterpart in nine of the ten years measured – including holding up better in the 2019 drawdown. The exception was 2023, when the founder-led cohort detracted more sharply as long-duration growth businesses repriced against higher discount rates. The pattern is consistent with the risk profile described below: founder-led companies have led value creation through most of the cycle, with greater amplitude in both directions.
Robustness
The most obvious objection is that founder-led performance is really technology exposure. Excluding technology from both cohorts, founder-led companies returned 13.55% annualised against 9.23% for non-founder-led companies and 9.83% for the benchmark ex-technology. The advantage narrows but persists.
A second test concerns scale. Among companies below US$500 billion in market capitalisation in 2016, 1.46% of founder-led companies had grown beyond US$500 billion by 2026, against 0.35% of non-founder-led companies. Founder-led businesses did not simply benefit from the mega-cap phenomenon; they were disproportionately likely to become it.
A third test examines whether market performance is supported by business fundamentals. On a market-cap weighted basis the founder-led cohort shows stronger revenue growth, EBITDA margin, free cash flow margin, R&D intensity and capex intensity – though not every metric, so the fair reading is stronger characteristics across several important dimensions rather than uniform superiority.
The risk side
Founder-led returns came with more volatility, not less. Annualised standard deviation was 18.66% against 14.23% for the benchmark, and maximum drawdown was -42.65% against -33.60%. The cohort underperformed through the 2022 rate shock before recovering strongly, and detracted sharply in 2023 as long-duration growth businesses repriced against higher discount rates.
Founder-led exposure is therefore better understood as a full-cycle compounding characteristic with higher sensitivity to growth expectations and risk appetite, rather than as a defensive allocation or a short-term trading signal.
The universe
Constituents are identified on a combination of founder and family ownership, governance and leadership factors. The classification is deliberately broader than founder-CEO status: founder influence can persist through ownership, board presence, voting control, strategic authority or capital allocation influence long after a company has professionalised its management. The universe is refreshed annually to reflect listings, delistings, index membership and classification changes, so the framework is assessed against an evolving listed universe rather than a fixed historical sample. The eligibility framework itself is proprietary and is not published in full.
This report analyses the Solactive large and mid-cap universe. Across all capitalisation bands, Lumenary Research screens a global all-cap universe of approximately 14,700 listed companies, of which around 4,500 are identified as founder-led, diversified across regions and sectors.
Download the report
The Founder Effect: Annual Report 2026 (PDF) →
Lumenary Research publishes evidence on founder-led companies globally. Subscribe to receive new research as it is released.
Analysis by Lumenary Research using Solactive index and benchmark data. Solactive AG has not sponsored, endorsed, approved or sold this research and does not guarantee the accuracy of its data; references to Solactive AG are for data attribution only. Results are historical and partly backtested, and past or simulated performance is not a reliable indicator of future performance. Research and general information only; not financial product advice.